On this page
It has never been easier to collect data about work. The hard part is knowing which numbers actually matter. Track too many metrics and you drown in dashboards. Track the wrong ones and you reward the wrong behaviour, such as looking busy instead of getting things done.
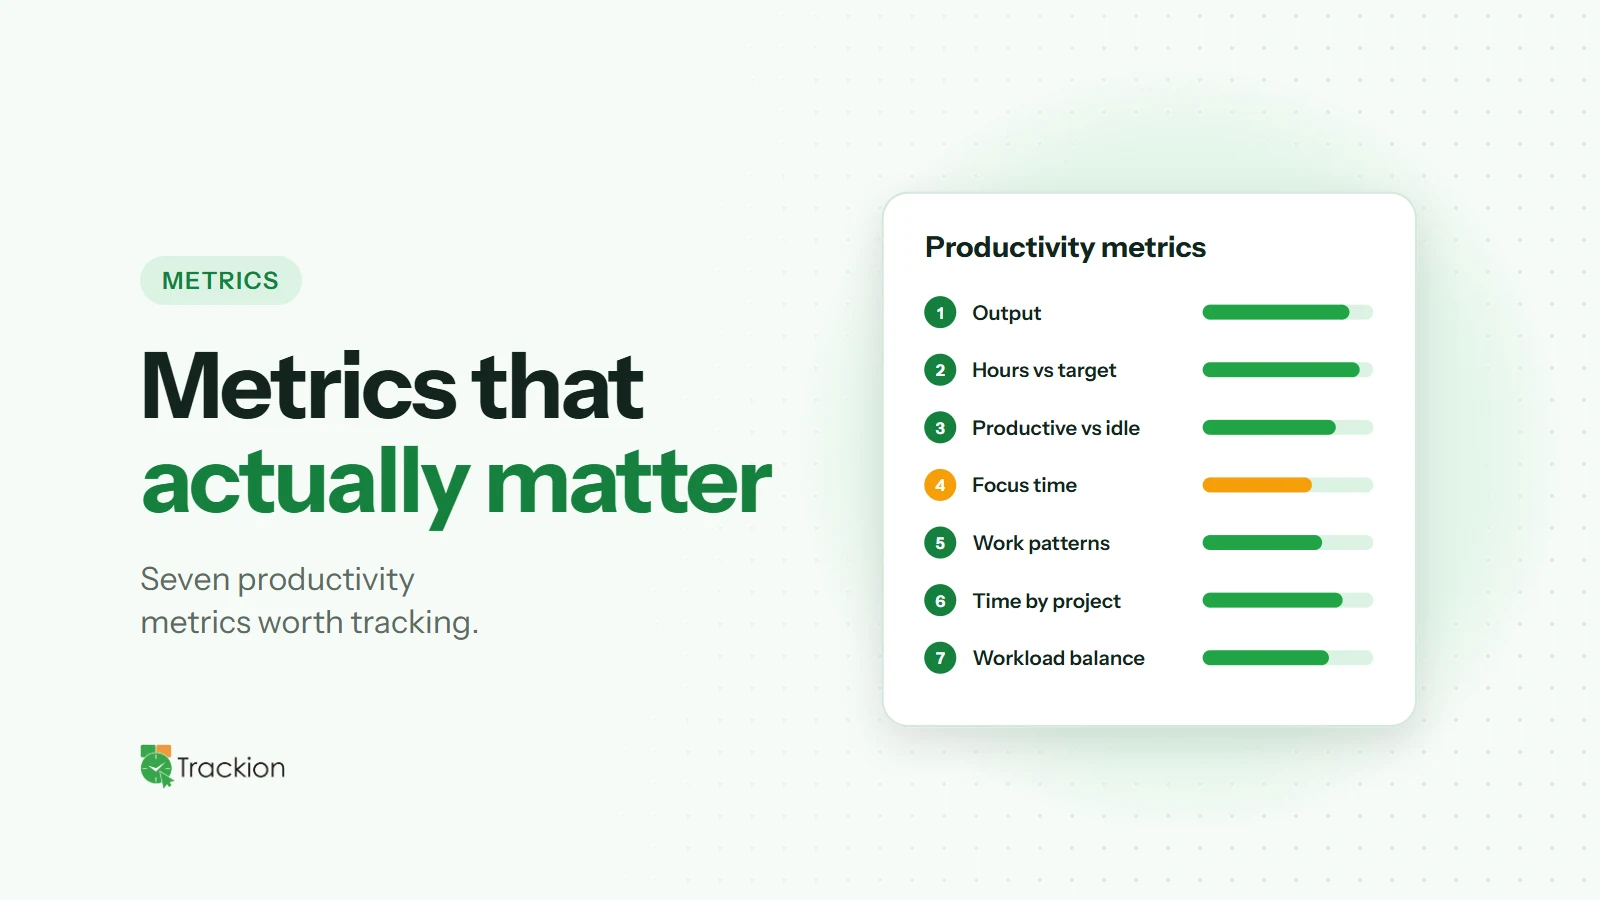
The most useful approach is a small, balanced set of metrics that combines results with how work happens. Here are seven worth considering, and how to use them fairly.
1. Output and Goal Completion
Start with results. What does good output look like for each role? For a support team it might be tickets resolved; for a developer, features shipped; for an agency, deliverables approved by clients. Measure how many agreed goals or tasks were completed in a period, and review the trend over time rather than single weeks.
2. Hours Worked Against Expectations
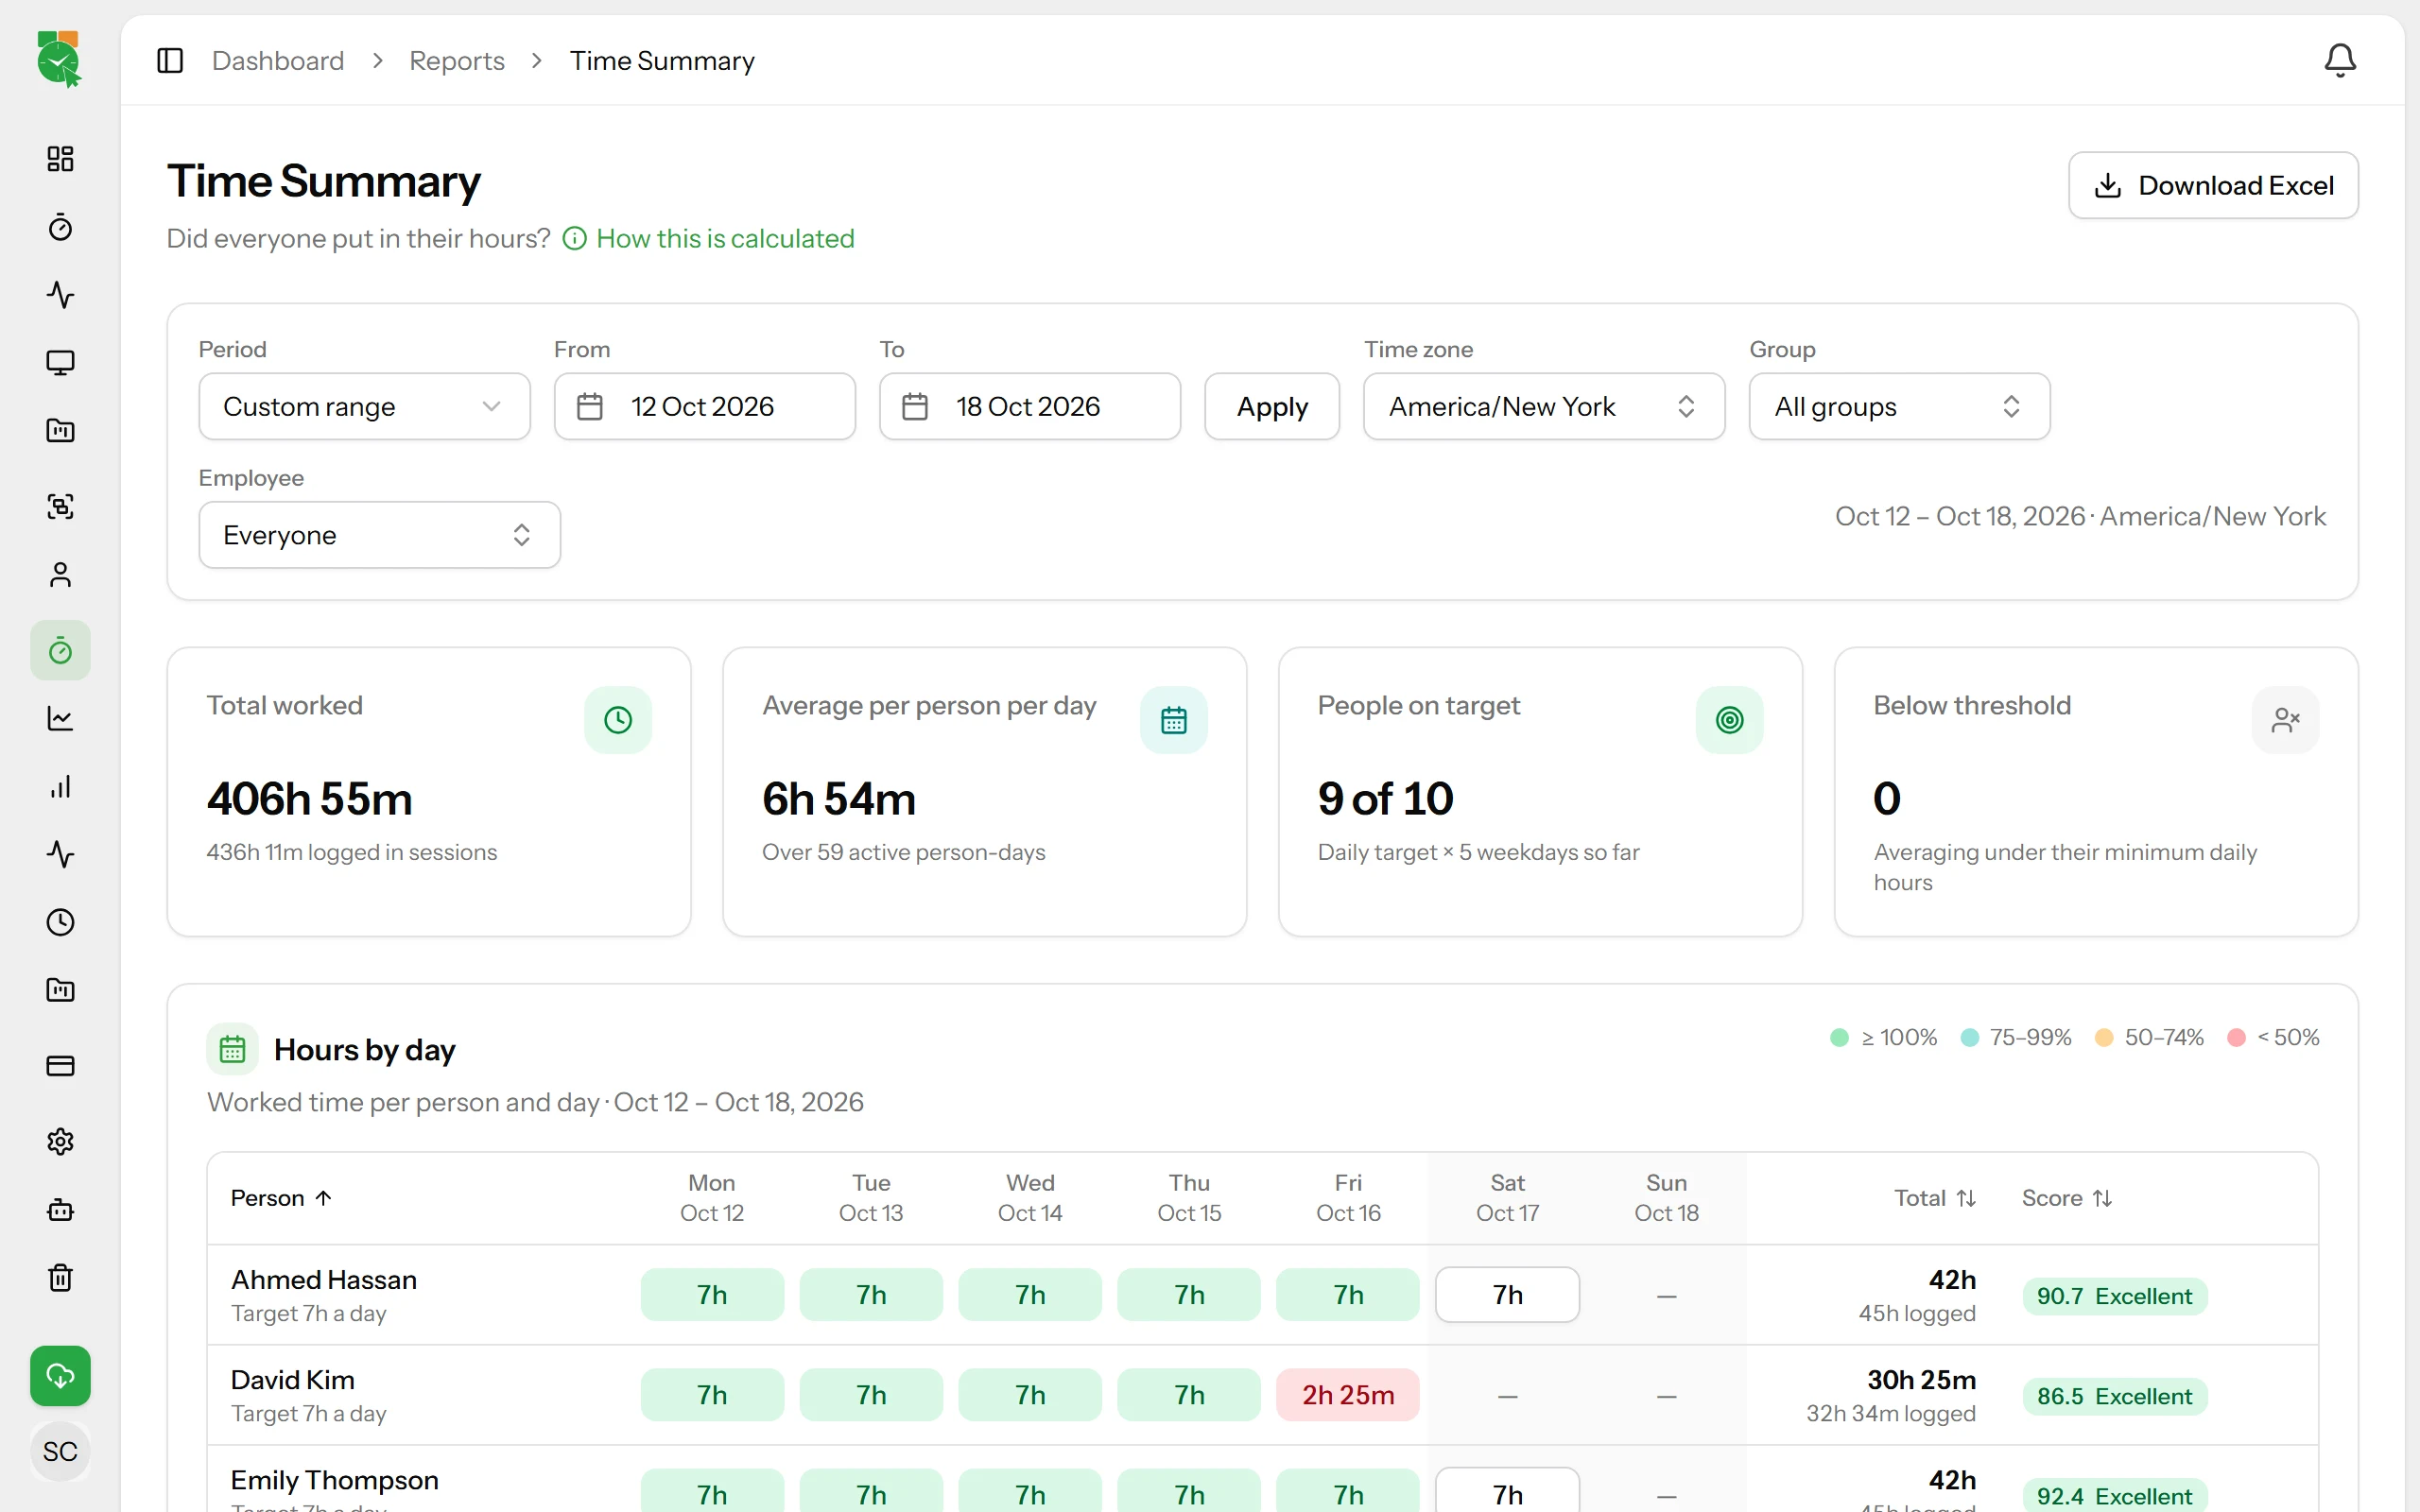
Hours are not productivity on their own, but they matter. Comparing tracked hours with expected hours shows who is consistently under capacity and, just as importantly, who is regularly working far beyond it. Both are signals worth a conversation.
3. Productive vs Idle Time
Splitting tracked time into active work and idle periods helps you understand the shape of a day. Some idle time is normal and healthy: thinking, reading, meetings away from the computer and breaks. What you are looking for is patterns, such as idle time steadily rising across a team, which may point to unclear priorities or blocked work.
4. Focus Time
Deep, uninterrupted work is where most valuable output comes from. Look at how much of the day people spend in sustained periods of high activity versus fragmented bursts. If focus time is shrinking, meetings, notifications or constant context switching may be the cause.
5. Work Patterns
When do people actually work? Patterns such as regular late nights, weekend sessions or very long days are early warning signs of burnout. They can also show when teams in different time zones overlap, which helps with scheduling.
6. Time by Project
Knowing how hours are spread across projects and clients helps with estimating, pricing and prioritizing. If a small client consumes a large share of your team's time, that is something you want to know before the next renewal conversation.
7. Workload Balance
Compare hours and output across team members. Uneven workloads are one of the most common causes of both underperformance and burnout. A balanced team is usually a more productive one.
How to Use Productivity Metrics Fairly
Keep the list short. Three to five metrics per role is usually enough.
Combine activity with outcomes. Activity data shows how work happens; outcomes show whether it worked.
Look at trends, not single days. Everyone has slow days. Patterns over weeks tell the real story.
Share the data. Let employees see their own metrics so there are no surprises.
Start conversations, not conclusions. Treat unusual numbers as questions to explore.
For more on striking this balance, read our guide on measuring productivity without micromanaging.
How Trackion Measures These Metrics
Trackion covers the time and activity side of productivity with six built-in reports. Time Summary compares weekly hours with each person's daily target. Performance Summary and Activity Rhythm show productive time and activity intensity, while Idle Time Deep Dive analyses breaks of five minutes or more.
Work Pattern Analysis shows when people work, and Project Tracking shows how hours are spread across projects. Every report can be filtered by team or person and exported to Excel.
Final Thoughts
The best productivity metrics are the ones that help you make better decisions and have better conversations. Choose a balanced handful, combine them with real outcomes and share them openly. That is how data becomes a tool for growth instead of a source of pressure.